IITJEE MODEL QUESTIONS
IIT JEE MODEL PAPER 2011
Passage 1
When heat is added to a gas, the temperature increases and the gas expands. If the gas is in a rigid container, then the volume remains constant and the pressure increases. If the gas in in a container that can expand (for example a cylinder with a vertical piston), then the pressure remains constant but the volume expands.
The amount of energy required to increase the temperature of one mole of gas is called the specific heat; there is a specific heat for constant pressure (Cp) and a specific heat for constant volume ((Cv).
In equation form, this is written:


Delta Q is the energy required to raise the temperature of the gas by a certain amount (delta T). The specific heats for a few gases, including monoatomic gases such as helium and argon, and diatomic gases such as nitrogen and oxygen, are given in the table below.
Passage 1
When heat is added to a gas, the temperature increases and the gas expands. If the gas is in a rigid container, then the volume remains constant and the pressure increases. If the gas in in a container that can expand (for example a cylinder with a vertical piston), then the pressure remains constant but the volume expands.
The amount of energy required to increase the temperature of one mole of gas is called the specific heat; there is a specific heat for constant pressure (Cp) and a specific heat for constant volume ((Cv).
In equation form, this is written:
Delta Q is the energy required to raise the temperature of the gas by a certain amount (delta T). The specific heats for a few gases, including monoatomic gases such as helium and argon, and diatomic gases such as nitrogen and oxygen, are given in the table below.
- 5:7
- 1:1
- 7:5
- 7:9
Discription: There is no need to do any calculations here. If you put X on top of Y, you will see that it reduces to the ratio of Cp for nitrogen over Cp for carbon monoxide. And since both gases have the same Cp, the ratio is simply 1:1.
Q. 2 The difference Cp - Cv is a constant. This constant is often called R, the universal gas constant. Which of the following is true given the data?
- For a monoatomic gas, Cp = 3/2 R
- For a diatomic gas, Cp = 3/2 R
- For a monoatomic gas, Cv = 3/2 R
- For a diatomic gas, Cv = 3/2 R
Discription: Helium and argon are monoatomic gases, and we can see that Cv = 3/2 *R = (3/2)*2 = 3.
Q. 3 How much energy would be required to heat two moles of methane by one degree if the gas is kept at constant volume?
- 6.5 calories
- 8.5 calories
- 11 calories
- 13 calories
Description: The definition of Cv is the amount of energy required to heat one mole of a gas by one degree. Therefore, to heat two moles of methane by one degree will require 2*6.5 = 13 calories.
Q. 4 Which of the following is a possible explanation for the fact that Cp is always greater than Cv?
- Some of the energy is used to expand the container in order to maintain constant pressure.
- A rigid container does not conduct heat as well as one that can change shape.
- There are generally more moles of gas when the pressure is kept constant than when the volume is kept constant.
- There are generally fewer moles of gas when the pressure is kept constant than when the volume is kep constant.
Discription: Because Cp is always greater than Cv we know that it takes more energy to increase a given amount of gas when the pressure is held constant. It is reasonable that the extra energy is used to increase the volume of the container.
Q. 5 A certain amount of energy, X, is sufficient to raise the temperature of 60 moles of argon by T degrees when the pressure is constant. How many moles of argon can be raised by T degrees with the same amount of energy X, if the volume is held constant?
- 30
- 50
- 75
- 100
Discussion: You can use the two equations:
You are given that X = 60*5*T. Let n be the number of moles that can be heated to temperature T with X calories of energy. Then X = n*3*T, and for this equation to be consistent with the previous one, it must be that n = 100.
Passage 2
When food is cooked, only some of the nutrients are preserved. Food scientists performed two experiments to study the retention of vitamin C after potatoes were cooked. The scientists measured the retention of ascorbic acid (AA) and dehydroascorbic acid (DAA). The sum of the amounts of AA and DAA equals the total amount of Vitamin C.
Experiment 1
In this experiment, potatoes were peeled and then fried. The following table shows the stability of ascorbic acid and dehydroascorbic acid after frying. The concentrations of AA and DAA are given in milligrams per 100 grams of dry potato.
| Sample | DAA (mg/100g) | AA (mg/100g) | Total Content of vitamin C (mg/100g) |
|---|---|---|---|
| Raw, peeled potatoes before frying | 7.4 | 44.6 | 52.0 |
| Fried potatoes 140o for 10 min 140o for 20 min 140o for 30 min 180o for 5 min | 29.7 33.7 42.7 42.8 | 20.6 7.3 0 0 | 50.3 41.0 42.7 42.8 |
In this experiment, potatoes were peeled and then boiled in water with varying concentrations of NaCl. The following table shows the stability of ascorbic acid (AA)and dehydroascorbic acid (DAA) after boiling.
| Sample | DAA (mg/100g) | AA (mg/100g) | Total Content of vitamin C (mg/100g) |
|---|---|---|---|
| Raw peeled potatoes Coocked in water Coocked in 1% NaCl Coocked in 5% NaCl Coocked in 10% NaCl | 7.4 9.0 9.1 7.1 5.8 | 43.1 17.1 13.1 11.2 8.9 | 50.5 26.1 22.2 18.3 14.7 |
- There is more DAA in fried potatoes than in raw, uncooked potatoes.
- There is more AA in fried potatoes than in raw, uncooked potatoes.
- There is more total vitamin C content in fried than in raw, uncooked potatoes.
- There is more AA in fried potatoes compared with uncooked potatoes, but only if they are fried at 140oC or lower.
Description: The concentration of DAA in uncooked potatoes is 7.4 mg/100 grams of dry matter. In the four examples of frying, the DAA concentrations ranged from 29.7 to 42.8, clearly indicating an increase.
Q. 7 If some potatoes were boiled in a 10% NaCl solution, and there were 300 grams of potato left, how many milligrams of vitamin C would there be?
- 14.7
- 17.4
- 26.7
- 44.1
Description: After potatoes are boiled in a 10% NaCl solution, there are 14.7 milligrams of vitamin C per 100 grams of potato. Therefore, if there were 300 grams of potato, there would be 14.7 * 3 = 44.1 milligrams of vitamin C.
Q. 8 What concentration of ascorbic acid would you expect to see if potatoes were fried for 45 minutes at 140oC?
- 0 mg/100 grams
- 7.3 mg/100 grams
- 20.6 mg/100 grams
- There is insufficient evidence to answer
Description: Although this question does break our rule concerning extrapolation, it is reasonable to infer from the given data that the ascorbic acid will be depleted. The data show a decreasing concentration until there is 0 mg/100 grams after 30 minutes of frying. Unless there is some process by which AA is suddenly created as the frying proceeds, the concentration will stay at zero.
Q. 9
- 31%
- 36%
- 52%
- 64%
If a potato is boiled in water with 5% NaCl, about what percentage of the original vitamin C will be lost?
Description: The table tells us how much Vitamin C will be retained. The concentration will be about 18 mg/100 grams of potato after cooking in a 5% NaCl solution, whereas for the uncooked potato, the vitamin C content is 50 mg per 100 grams. That means about 36% of the Vitamin C is retained. But this means that about 64% is lost.
Q. 10 All of the following explanations could account for the different pattern of DAA retention when comparing frying and boiling except:
- When immersed in water, the AA is less likely to oxydize to become DAA.
- When immersed in water, DAA is hydrolized to become 2,3-diketogluconic acid.
- Frying increases the likelihood for DAA to break down into other compounds.
- Frying dries out the potatoes and reduces the tendency for DAA to hydrolyze.
Description: If it were true that frying increased the likelihood of DAA breaking down into other compounds, then we would expect to see less DAA when frying than when boiling. But the opposite is true, so this explanation must be false.
Passage 3
Gamma ray bursts are bursts of very high energy electromagnetic radiation that astronomers have observed to occur roughly once per week at random locations in the sky. These bursts present a puzzle to scientists and two astronomers, Jesse and Becky, take different positions.
Jesse:
The bursts appear to be isotropic - that is evenly spread out in the sky. But our galaxy is disk shaped, so if the sources were within our galaxy, then they would not appear uniformly across the sky. Therefore, the gamma ray bursts must originate outside our galaxy.
Becky:
The problem is that each of these bursts contains a large amount of gamma radiation. If a single light bulb appeared bright from a large distance, then it would have to be a very powerful bulb. The same thing is true of gamma ray bursts. They appear bright to us, and if they are far away and if the energy emanates from them in all directions, the source must be extraordinarily powerful. We do not know of any mechanism in the universe that could produce that much energy. Therefore, the gamma ray bursts must come from lower energy sources closer to us.
Q. 11 Which of the following is an assumption made by Becky, but not necessarily by Jesse?
- Gamma ray bursts carry electromagnetic radiation.
- The energy from a gamma ray burst spreads out evenly in a sphere.
- Our galaxy is shaped like a disk.
- The direction of a light source can be determined.
Description: Becky uses this assumption to argue that the source of energy must be enormously powerful. But what if the gamma ray burst were directed in a thin beam at the Earth? Then an astronmer would not have to worry that the energy we see on Earth is only one tiny tiny fraction of the energy of the source. We might see most or all of the energy of the source, as if a light beam were pointed directly at us. The assumption that the gamma radiation emanates in all directions from its source is critical to Becky's argument, but Jesse may well disagree
Q. 12 Which of the following new observations would most weaken the argument of Jesse?
- Observations from the southern sky showing uniformly distributed gamma ray bursts.
- Observations of bursts of x-rays coming from sources far outside our galaxy.
- Observations showing that our galaxy is not actually disk shaped, and is in fact more like a sphere.
- Observations showing that earlier studies had overestimated the energy coming from gamma ray bursts.
Description: Jesse's essential point is that we see gamma ray bursts spread out in a shape that is different from the shape of our galaxy. If it turns out that our galaxy is not disk shaped, and indeed is spherical, then her argument is considerably weakened.
Q. 13 Which of the following would most weaken Becky's argument that the bursts could not occur far outside our galaxy?
- New measurements showed that the bursts do occur in a disk shaped pattern.
- The discovery that astronomical events occurring very close to the Earth also appear uniformly across the sky.
- The discovery that gamma ray bursts occur twice as frequently as previously thought.
- The discovery that the collision of black holes could theoretically produce more energy than any other known event.
Description: Becky's argument is based strongly on the fact that we do not know of any astronomical events that could yield the energy required for the gamma ray bursts. If new sources of high energy events are discovered, then her argument is weakened.
Q. 14 The two astronomers disagree most as to:
- the existence of gamma ray bursts.
- the timing of the gamma ray bursts.
- the location of the source of the gamma ray bursts.
- the amount of energy reaching Earth from the gamma ray bursts.
Description: Jesse presents an argument to show that the gamma ray bursts must occur outside our galaxy; Becky argues that the gamma ray bursts must occur closer to home. The two astronomers differ most about the location of the source of the gamma ray bursts.
Q. 15 Light from sources far from the Earth is often redshifted, which means that it has a longer wavelength. Which of the following, if true, would most support Jesse's position?
- Radiation from the gamma ray bursts is redshifted similarly to objects known to be within our galaxy.
- Radiation from the gamma ray bursts is redshifted in a pattern similar to objects known to be far outside our galaxy.
- The radiation is not redshifted at all.
- The radiation is redshifted, but not in a way that is similar to any known objects.
Description: If the light from the gamma ray bursts has similar redshift to light from other sources far outside the galaxy, then it would be evidence in favor of Jesse's position that the sources of the bursts originate far outside our galaxy.
Passage 4
The following table represents the concentration of ions and dissolved gases in the sediment at the bottom of an ocean. A depth of 0 centimeters (cm) represents the top of the sediment. The concentrations are expressed in parts per million (ppm). The acidity of a solution is represented on a scale known as pH. A pH of 1 is very acidic, a pH of 7 is neutral, and a pH of 14 is very basic.
| Depth (cm) | Temperature (oC) | pH | Concentration in sediment (ppm) | |||||
|---|---|---|---|---|---|---|---|---|
| SO42- | S2- | CO2 | Fe3+ | Fe2+ | O2 | |||
| 0 | 4 | 7.0 | 7.0 | 0.0 | 1.0 | 4.0 | 0.5 | 2.0 |
| 5 | 5 | 6.5 | 5.0 | 2.0 | 1.5 | 3.0 | 1.5 | 1.0 |
| 10 | 7 | 6.0 | 3.5 | 3.5 | 2.0 | 2.0 | 2.0 | 0.0 |
| 15 | 9 | 5.5 | 3.3 | 3.8 | 3.0 | 0.8 | 3.8 | 0.0 |
| 20 | 10 | 5.0 | 3.0 | 4.0 | 1.0 | 0.5 | 4.0 | 0.0 |
- Sulfide (S2-)
- Carbon dioxide (CO2)
- Ferric iron (Fe3+)
- Oxygen (O2)
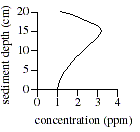
- Ferrous iron (Fe2+)
- Oxygen (O2)
- Carbon dioxide (CO2)
- Sulfate (SO42-)
- 1.5.
- 3.5.
- 4.5.
- 6.0.
- 0 cm
- 5 cm
- 10 cm
- 15 cm
- O2 concentration
- Fe3+ concentration
- S2- concentration
- pH
-
Passage 5
The Sun's path from sunrise to sunset varies with the time of year. A student performed the following experiments on three clear, sunny days at three- or four-month intervals throughout the course of a year to study the path of the Sun through the sky.
Experiment 1
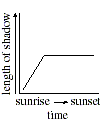
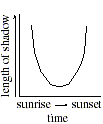
At a chosen Northern Hemisphere location, the student placed a stick vertically into the ground so that 1 meter of its length was left above ground. The student knew that the length of the shadow was related to the height of the Sun above the horizon and that the shadow would point away from the direction of the Sun. The length in meters (m) and direction of the shadow cast by the stick were measured one hour after sunrise (Shadow A), at mid-morning (B), at noon (C), at mid-afternoon (D), and one hour before sunset (E) on each of the three days. The direction of each shadow was determined by placing a magnetic compass at the base of the stick and aligning the north arrow with the north mark on the compass. The direction of each shadow was then determined by a comparison with the compass face markings. The results are recorded in Table 1.
Table 1:
| Shadow | Day 1 | Day 2 | Day 3 | |||
|---|---|---|---|---|---|---|
| Length (m) | Shadow direction | Length (m) | Shadow direction | Length (m) | Shadow direction | |
| A | 5.0 | SW | 8.6 | NW | 6.8 | W |
| B | 1.2 | W | 2.9 | NNW | 1.7 | NW |
| C | 0.3 | N | 2.3 | N | 0.9 | N |
| D | 1.2 | E | 3.0 | NNE | 1.8 | NE |
| E | 5.0 | SE | 8.6 | NE | 6.9 | E |
Experiment 2
The following year, the student repeated Experiment 1 at a chosen location in the Southern Hemisphere. The results are in Table 2.
Table 2:
The following year, the student repeated Experiment 1 at a chosen location in the Southern Hemisphere. The results are in Table 2.
Table 2:
| Shadow | Day 1 | Day 2 | Day 3 | |||
|---|---|---|---|---|---|---|
| Length (m) | Shadow direction | Length (m) | Shadow direction | Length (m) | Shadow direction | |
| A | 9.0 | SW | 5.0 | NW | 6.9 | W |
| B | 3.2 | SSW | 1.1 | W | 1.8 | SW |
| C | 2.5 | S | 0.3 | S | 1.0 | S |
| D | 3.2 | SSE | 1.1 | E | 1.8 | SE |
| E | 9.1 | SE | 5.0 | NE | 6.9 | E |
- Length of vertical stick exposed
- Shadow direction
- Day of the year
- Shadow length
- They would be twice as long as those in the original experiments.
- They would be one-and-one-half times as long as those in the original experiments.
- They would be one-half as long as those in the original experiments.
- They would be one-fourth as long as those in the original experiments.
- Day 1 in Experiment 1
- Day 1 in Experiment 2
- Day 2 in Experiment 1
- Day 3 in Experiment 2
- The direction of sunrise along the horizon varies throughout the year.
- Shadows never point due south in the Northern Hemisphere.
- Shadows never point due north in the Northern Hemisphere.
- The Sun's brightness varies throughout the year.
- The Sun travels a more southerly path in the Southern Hemisphere than in the Northern Hemisphere.
- The Sun travels a more northerly path in the Southern Hemisphere than in the Northern Hemisphere.
- The Sun rises in the East and sets in the West in the Northern Hemisphere, but the opposite is true in the Southern Hemisphere.
- The Sun rises in the West and sets in the East in the Northern Hemisphere, but the opposite is true in the Southern Hemisphere.
Passage 6
The relationship between pressure and volume of a gas was studied while the temperature was held constant. A container was filled with helium gas at room temperature and sealed (see figure below). The pressure on the gas could be controlled by varying the force exerted on the plunger, and the volume could be determined by the height of the plunger.
(Note: Assume that the mass of the plunger is insignificant.)
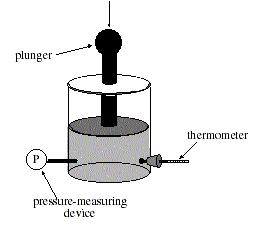
Experiment 1
The initial pressure in this experiment was 1 atmosphere (atm). At that pressure the gas occupied 1 liter (L). The pressure of the helium was increased very slowly, by decreasing the volume, so that the gas remained at room temperature. The heat generated was released into the surrounding atmosphere. The pressure and the volume of the helium were recorded in Table
Table 1.
| Pressure (atm) | Volume L |
|---|---|
| 1.0 | 1.00 |
| 1.5 | 0.67 |
| 2.0 | 0.50 |
| 2.5 | 0.40 |
| 3.0 | 0.33 |
Experiment 1 was repeated at room temperature with an initial pressure of 1 atm and an initial volume of 2 L. The results are shown in Table 2.
| Pressure (atm) | Volume L |
|---|---|
| 1.0 | 2.00 |
| 1.5 | 1.33 |
| 2.0 | 1.00 |
| 2.5 | 0.80 |
| 3.0 | 0.67 |
In this experiment the entire gas container was insulated to prevent heat loss. The procedures from Experiment 1 were repeated. It was observed that the temperature of the gas rose as the volume decreased. Table 3 shows the volume measured at each pressure during the compression.
| Pressure (atm) | Volume L |
|---|---|
| 1.0 | 1.00 |
| 1.5 | 0.78 |
| 2.0 | 0.66 |
| 2.5 | 0.58 |
| 3.0 | 0.52 |
Q. 27 How is the design of Experiment 1 different from that of Experiment 2?
- The container is insulated in Experiment 2, but not in Experiment 1.
- A different gas is used in Experiment 2 than in Experiment 1.
- The initial volume of the gas in Experiment 1 is half that of Experiment 2.
- The initial volume of the gas in Experiment 1 is twice that of Experiment 2.
- an identical container made of a different material than the original.
- an identical volume of water.
- several different gases.
- an unsealed container.
- 0.25 L.
- 0.33 L.
- 0.50 L.
- 1.00 L.
- 0.20 L
- 0.30 L
- 0.40 L
- 0.44 L
- The pressure increased, causing the temperature to decrease.
- The volume decreased, causing the temperature to decrease.
- Heat flowed from the surrounding atmosphere, through the container, and into the gas.
- Heat flowed from the gas, through the container, and into the surrounding atmosphere.
- They would be the same as those in Experiment 1.
- They would be the same as those in Experiment 3.
- They would be greater than those in Experiment 2.
- They would be smaller than those in Experiment 1.
Passage 7
Several methods were investigated to reduce pollution emissions from a steel mill smokestack. Steel is mostly iron (Fe), but it also contains carbon (C). Impurities containing sulfur (S), nitrogen (N), or phosphorus (P) form gaseous compounds with oxygen that become pollutants. The smoke contains these pollutants and also tiny dust particles that pollute the air, are blown around by the wind, and eventually fall to the ground.
Method 1
Steel mill smoke was passed across a set of electrified plates in the smokestack. The electrified plates attracted the dust particles in the smoke and removed them from the emissions. The efficiency of dust particle removal, which is dependent on the size of the particles, is shown in Table 1.
Table 1.
| Voltage on plates (V) | Particles removed (%) |
|---|---|
| 100 | 20 |
| 200 | 50 |
| 500 | 90 |
| 1,000 | 80 |
| 3,000 | 70 |
Method 2
The smoke was passed through filters of different pore size in the smokestack that trapped dust particles and also decreased the amount of smoke leaving the stack. The data are shown in
Table 2.
The smoke was passed through filters of different pore size in the smokestack that trapped dust particles and also decreased the amount of smoke leaving the stack. The data are shown in
Table 2.
| Filter pore size (microns) | Particles trapped (%) | Amount of time for filters to drop to 50% efficiency (hours) |
|---|---|---|
| 1,000 | 5 | 2,000 |
| 500 | 20 | 1,000 |
| 200 | 50 | 200 |
| 100 | 80 | 25 |
| 50 | 90 | 1 |
Method 3
To reduce pollution by chemical means, the smokestack emissions were bubbled through solutions of concentrated alkali (solutions of OH- ions). Table 3 shows the percent of the 3 pollutants removed versus the alkali concentration.
Table 3.
       Â
To reduce pollution by chemical means, the smokestack emissions were bubbled through solutions of concentrated alkali (solutions of OH- ions). Table 3 shows the percent of the 3 pollutants removed versus the alkali concentration.
Table 3.
       Â
| Alkali concentration (%) | S removed (%) | N removed (%) | P removed (%) |
|---|---|---|---|
| 1 | 80 | 60 | 10 |
| 3 | 90 | 65 | 40 |
| 5 | 91 | 60 | 35 |
| 10 | 92 | 50 | 30 |
| 15 | 93 | 20 | 25 |
- 1%
- 3%
- 5%
- 10%
- A higher alkali concentration results in more P removed.
- A higher alkali concentration results in more S removed.
- A lower alkali concentration requires more filters to remove dust particles.
- A lower alkali concentration results in an increased time required to remove all of the chemical pollutants
- requires the highest voltage across the electrified plates.
- reacts with alkali solutions.
- needs to be replaced least often.
- needs to be replaced most often.
- Filter efficiency would decrease because dust particles could more easily fall back down the stack.
- Electrostatic plate efficiency would increase because voltage increases with height.
- Dust particles would accumulate into larger pieces and would be more easily removed from the smoke.
- It cannot be determined from the given information.
- Emissions can only be removed by filters.
- Emissions can only be removed by electrified plates.
- Emissions must be captured in the smokestack to be removed.
- Emissions must be captured after they leave the smokestack.
- Determining where the particulate matter falls to the ground after leaving the smokestack
- Determining what sizes of particles are removed from the smoke at different voltages
- Determining how the filters react when an alkali solution is passed through them
- Determining how the filters react when an acid solution is passed through them

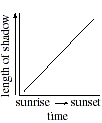
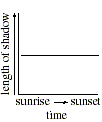
No comments:
Post a Comment